Much like an exciting motorcycle trip with Ewan McGregor and Charley Boorman, signals travel from your brain to your muscles to your surface electromyography (sEMG) sensor and end up on your screen. This article covers this trip and provides clinicians with pointers on best practices when using sEMG biofeedback.
sEMG and your patient
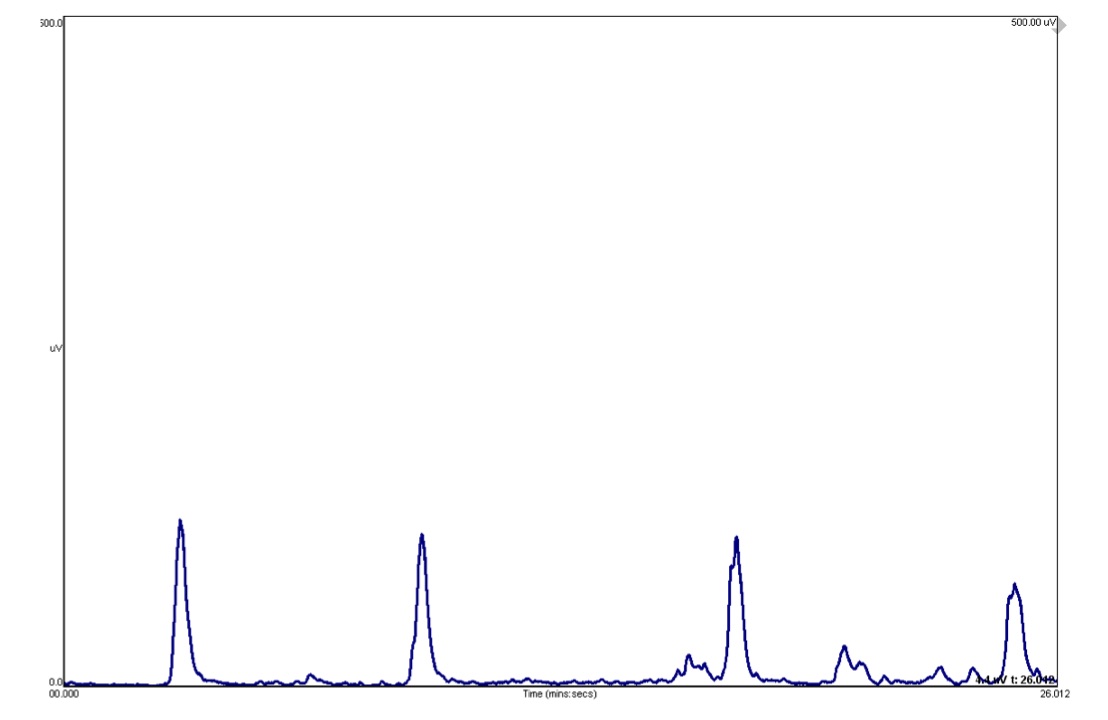
You begin dysphagia exercises with your patient using your sEMG biofeedback system and see a signal on your computer screen that may look like the one below (figure 1). Even if you’ve never used sEMG before, you can deduce very quickly that when your patient swallows, the blue line goes up, and when your patient relaxes, the line is flat. But what does this line mean in relation to your patient’s swallow? And why is the vertical axis in mV (microvolts)? Aren’t newtons (N) the unit for force? Or maybe kilopascals (kPa) for pressure?
These are all excellent questions, and I hope to answer them in this article. My goal is to make what I think is a beautiful technology accessible to everyone who is interested in understanding it just a little bit more.
From the brain to the muscle
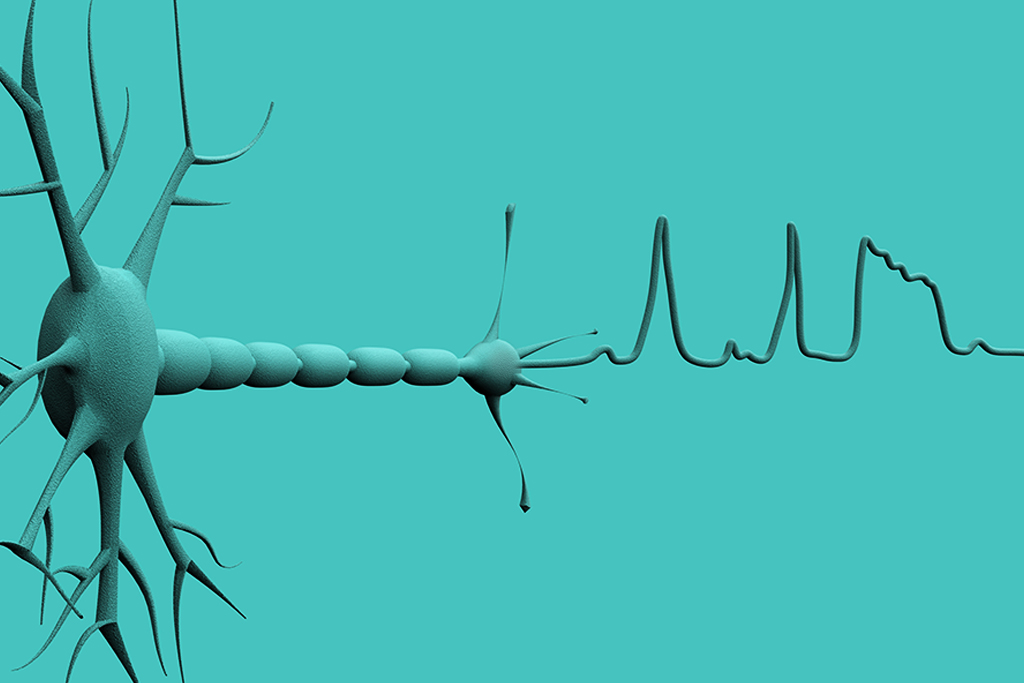
Our journey begins in the brain of course. We know that our brains are brimming with electrochemical activity. An adult brain is said to contain over 80 billion neurons (Azevedo et al., 2009). That is almost as many stars as there are in our galaxy! Each one of these little neurons can send off several messages (called action potentials) per second letting you do everything you do: anything from picking up a pen, to reading this article, to swallowing safely and efficiently.
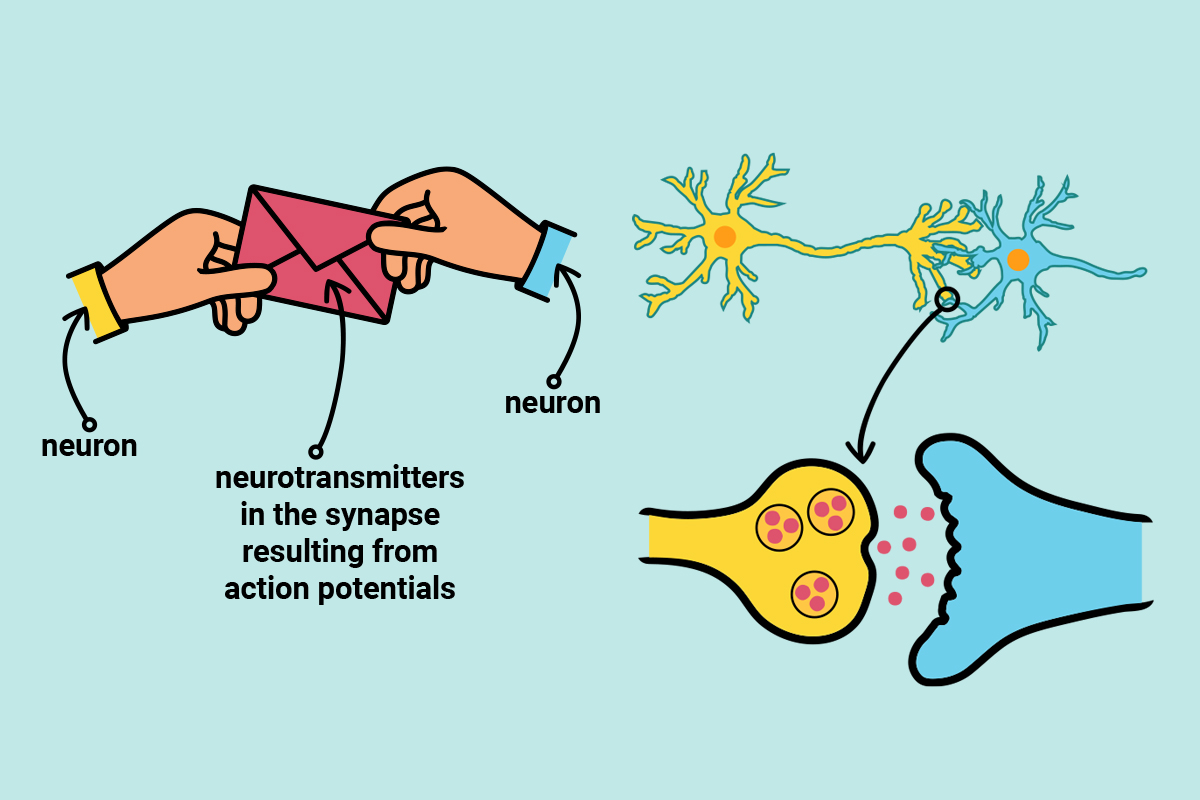
Action potentials are messages sent along neuron cells. Neurotransmitters are messages sent between neuron cells.
Action potentials are brief electrical events that travel along the length of axons (the long tail-like portion of the neuron) and ultimately trigger the release of neurotransmitters (figure 2). These action potentials are what is ultimately picked up by the sEMG sensors at the surface of the skin.
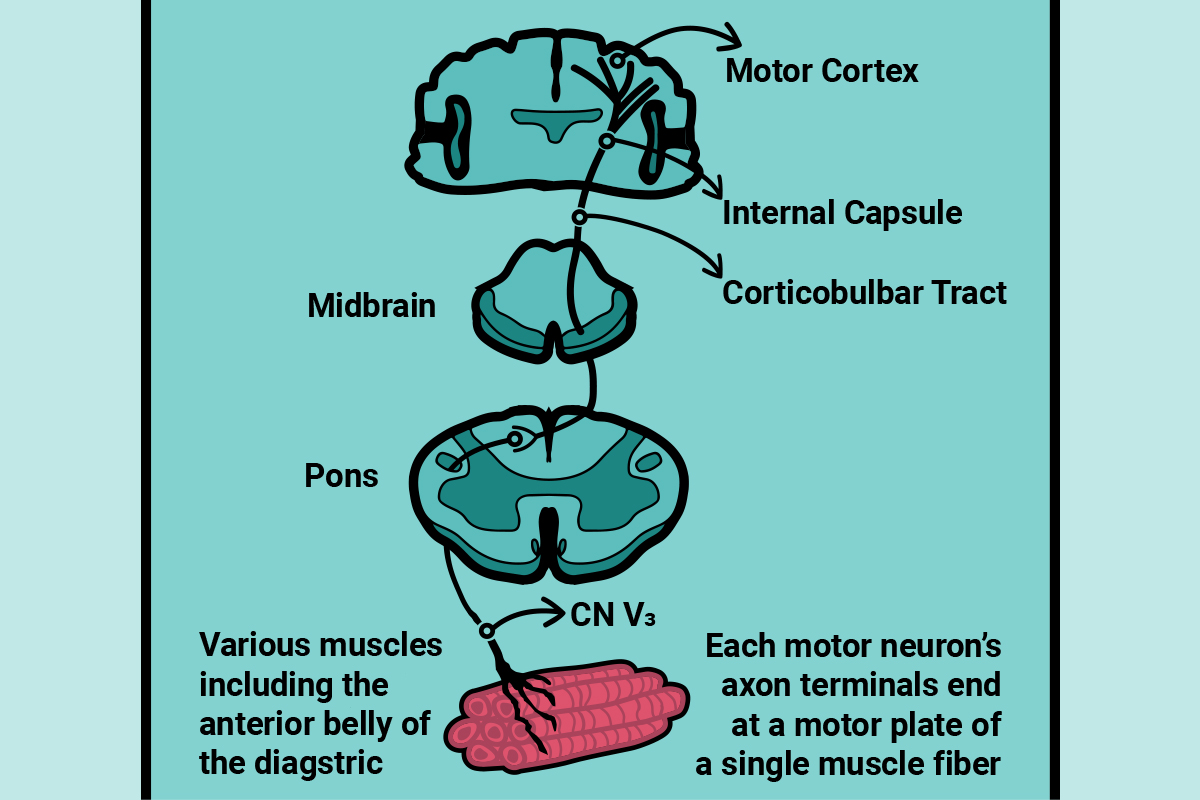
Most people reading this article are likely already familiar with messages (action potentials) making their way from the cerebral cortex down to cranial nerves and all the way to muscle fibers (figure 3). In the example shown in figure 3, the nerve of the mandibular branch of the trigeminal nerve is seen innervating the anterior belly of the digastric muscle (Kim & Loukas, 2019). Super! But how do these signals result in muscle movement?
The anterior belly of the digastric, much like most muscles involved in swallowing, is striated (Shaw & Martino, 2013). If we were to zoom in on it closer and closer, we’d find that cells from these types of muscles (called myofibers), are made up of myofibrils, which are made up of sarcomeres, which in turn are made up of tiny repeating units containing actin and myosin filaments. Now we’re really zoomed in! That’s okay, we needed to get this close. It’s the action of these little filaments that ultimately results in what we call a muscle contraction. The neuron in figure 3 (blue line) is called a motor neuron. When a motor neuron touches a muscle, the action potential spreads inside the muscle cell and triggers a chain reaction that ultimately results in muscle contraction. To sustain a muscle contraction (and not just a simple twitch), repeated activation must occur.
From the muscle to the sensor
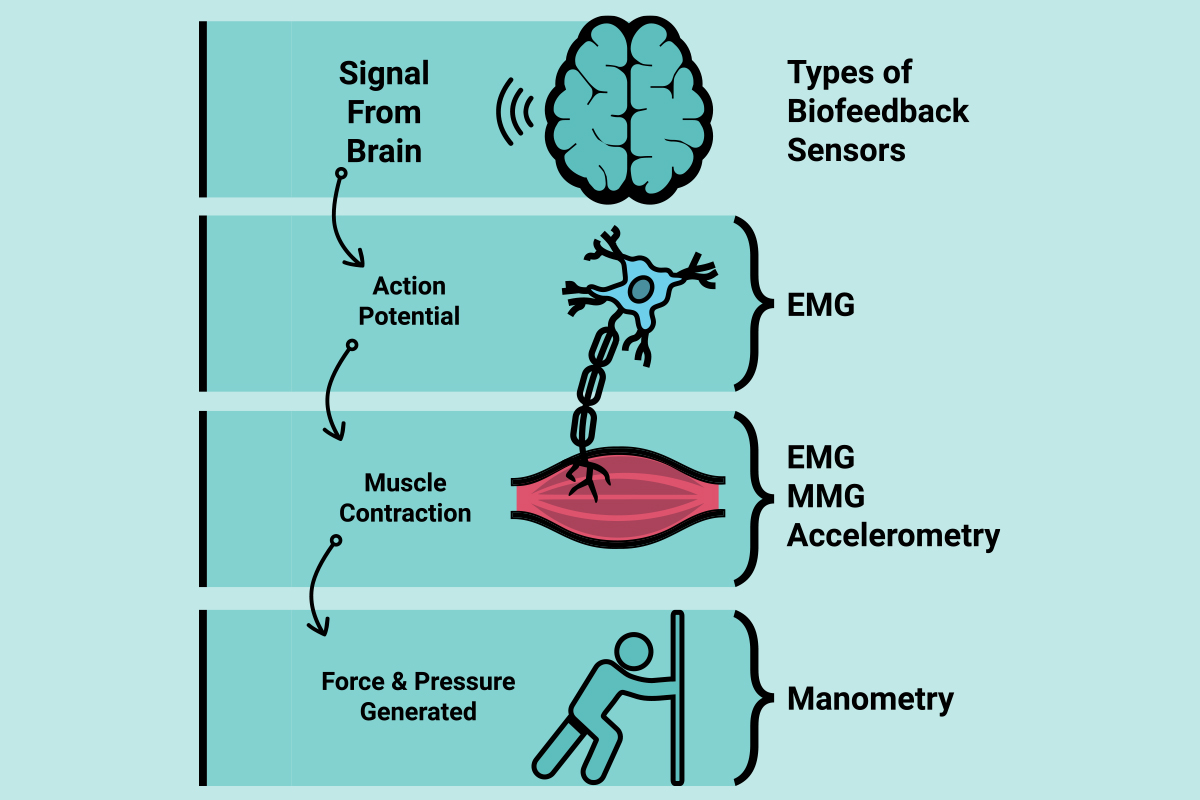
These little messages (action potentials) are what sEMG sensors pick up at the surface of the skin. What this means is that sEMG sensors do not measure the result of a muscle contraction such as force (newtons) or pressure (kilopascals). Instead, sEMG sensors pick up the electrochemical events taking place before and during a muscle contraction (microvolts) (Vigotsky, Halperin, Lehman, Trajano, & Vieira, 2017) (figure 4). And in the biased opinion of this author, this makes sEMG sensors super cool because they can tell you so much more!
sEMG sensors detect action potentials at the level of the skin and hence, those action potentials may come from different muscles under the surface of the skin. For example, sensors placed in the submental area may be picking up signals from the anterior belly of the digastric, but also from the mylohyoid and the platysma. Consequently, sEMG signal can vary depending on slight differences in sensor placement. Also, the signal or messages have undergone some modification just by virtue of having passed through all the layers of adipose and skin tissue to arrive at the sensor.
From the sensor to the screen
The sEMG signal picked up by the sensors is recorded by the device you’re using and undergoes further modifications, this time not from your body’s own tissues, but rather programmed in by biomedical engineers. Although the rationale for these modifications is the same across companies, slight variations exist on how it is achieved. These modifications may include making the signal bigger (amplified) and making the signal all positive (rectified). The signal may also be filtered to remove or reduce electrical noise and movement artifacts (Stepp, 2012). And lastly, the signal may be turned into a smooth outline or “envelope” for easier interpretation (smoothing). The resulting sEMG signal shape such as the one in figure 1 is easy to interpret quickly and can be used by clinicians to monitor muscle activity. What this means though is that one companies’ 100mV might be another’s 95mV.
sEMG biofeedback and swallowing exercises
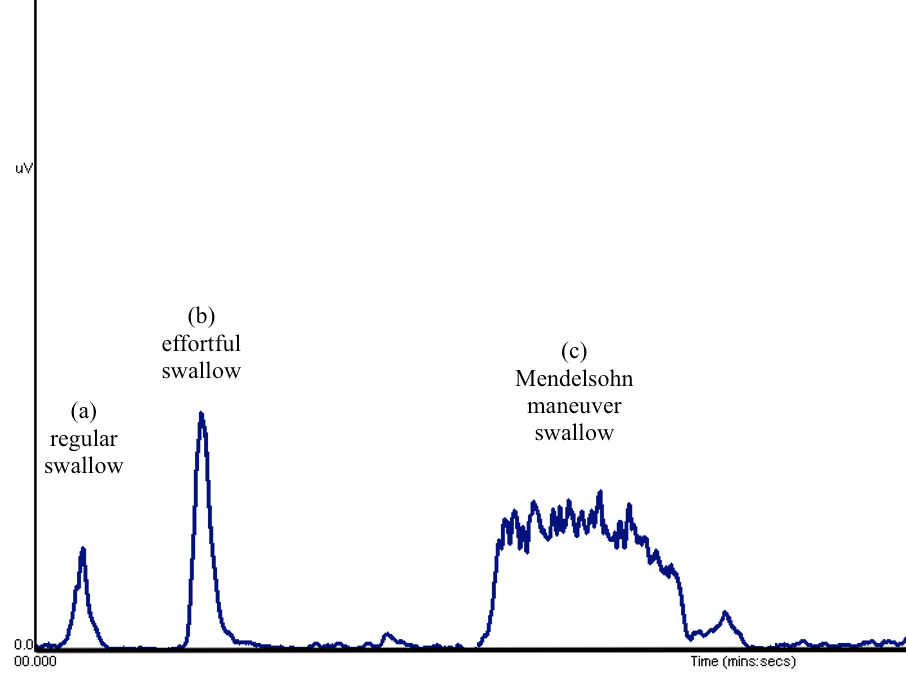
When working with patients, sEMG biofeedback can be used to teach and practice various swallowing exercises. For example, sEMG signal for a regular swallow may look like a simple peak (figure 5, (a)). When completing an effortful swallow, the shape of the signal may look like that of a regular swallow, but the peak is higher (figure 5, (b)). This is because more effort may result in more motor units being recruited and hence more action potentials being detected by the sensor. When completing a Mendelsohn maneuver swallow on the other hand, the shape of the signal will change to resemble the flat mountain from a beloved classic movie, Close Encounters of the Third Kind (figure 5, (c)). This is because of a sustained muscle contraction over time.
What are some important takeaways for using sEMG in the clinic
- sEMG signal is a great indicator of muscle excitation.
- sEMG signal is a great adjuvant to swallowing exercise, in the clinic or at home (Albuquerque, Pernambuco, da Silva, Chateaubriand, & da Silva, 2019). It can be used as biofeedback to bring awareness to muscle contraction (e.g., for education), and relative muscle contraction (e.g., elicit more effort during a swallow or a longer sustained contraction).
- Because sEMG signal on its own can vary between sessions, calibrated values should be used for clinical targets. What this means is that rather than targeting a given amplitude mV as a goal, clinicians should work with percentages (e.g., 90%, 110%, 200%, of a regular swallow obtained in that session, for that sensor placement).
- Biofeedback can be used to build habits by showing patients incremental improvements and by tracking their adherence to an exercise program.
- Progress can be measured using outcomes meaningful to both, the patient (e.g., shorter mealtime) and the clinician (e.g., instrumental evaluation of swallow safety and efficiency).
- sEMG signal can be very informative when you have access to a crafty data scientist who can pull information using sophisticated techniques. Until then, the best approach to using sEMG is as biofeedback (rather than a pre/ post measure of force production). In the words of another author,
- “Collectively, sEMG studies that aim to draw conclusions about muscle force production, […] are problematic when based solely on sEMG amplitude. Oftentimes, in order to draw mechanistic conclusions, more advanced sEMG processing and modeling techniques are needed.” (Vigotsky et al., 2017).
References
Albuquerque, L. C. A., Pernambuco, L., da Silva, C. M., Chateaubriand, M. M., & da Silva, H. J. (2019). Effects of electromyographic biofeedback as an adjunctive therapy in the treatment of swallowing disorders: a systematic review of the literature. Eur Arch Otorhinolaryngol, 276(4), 927-938. doi:10.1007/s00405-019-05336-5
Azevedo, F. A., Carvalho, L. R., Grinberg, L. T., Farfel, J. M., Ferretti, R. E., Leite, R. E., . . . Herculano-Houzel, S. (2009). Equal numbers of neuronal and nonneuronal cells make the human brain an isometrically scaled-up primate brain. Journal of Comparative Neurology, 513(5), 532-541. doi:10.1002/cne.21974
Kim, S. D., & Loukas, M. (2019). Anatomy and variations of digastric muscle. Anatomy and Cell Biology, 52(1), 1-11. doi:10.5115/acb.2019.52.1.1
Shaw, S. M., & Martino, R. (2013). The normal swallow: muscular and neurophysiological control. Otolaryngologic Clinics of North America, 46(6), 937-956. doi:10.1016/j.otc.2013.09.006
Stepp, C. E. (2012). Surface Electromyography for Speech and Swallowing Systems: Measurement, Analysis, and Interpretation. Journal of Speech, Language, and Hearing Research, 55(4), 1232-1246. doi:10.1044/1092-4388(2011/11-0214)
Vigotsky, A. D., Halperin, I., Lehman, G. J., Trajano, G. S., & Vieira, T. M. (2017). Interpreting Signal Amplitudes in Surface Electromyography Studies in Sport and Rehabilitation Sciences. Frontiers of Physiology, 8, 985. doi:10.3389/fphys.2017.00985


